Bank credit and boom/bust cycles
Most of the concern on Wall Street has been focused on the latest GDP statistics released by the Commerce Department which showed U.S. economic growth slowed in the third quarter to its lowest level in more than three years. The weaker housing market was one reason for the third quarter downturn in the economy - investment in homebuilding was cut by 17.4% - its biggest amount since early 1991 according to reports - and another area of blame was the higher energy prices and interest rates that were common heading into September.
But that's looking in the economic rear-view mirror and we're not interested in the rear-view mirror approach. What we're interested in knowing is not so much "how" or "why" the economy was slower last quarter (that much became evident months ago). What we really want to know is "what direction" will the economy travel in the fourth quarter and beyond. For that we must turn to the latest liquidity trends as published by the St. Louis Federal Reserve Bank.
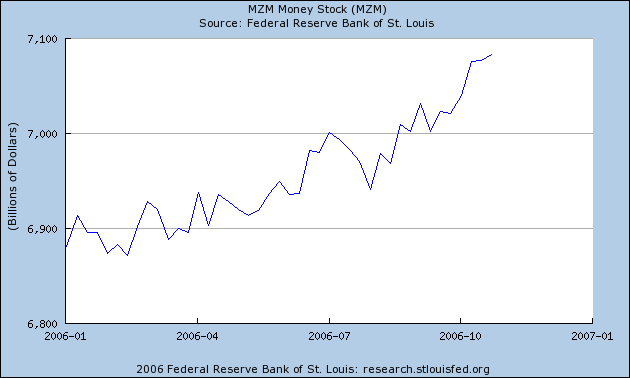
There are three measures of how the economy will respond to changes in the money supply and all three can provide us with a good "heads-up" on what to expect for the weeks and months ahead in the economy and financial system. These three measures are the Adjusted Reserves, MZM Money Stock, and Bank Credit. We'll take a closer look at some of these numbers later in this commentary.
The Commerce Department also released number showing consumer spending was up a paltry 0.1 percent in September, the smallest increase in 10 months. Again, this isn't surprising given the 8-year liquidity cycle that bottomed in September. As per our previous discussions, the media is too caught up in looking at the economy from the proverbial rear-view mirror instead of looking forward. The economic statistics released by Washington are always several weeks-to-months behind the true trend. To get a truer reading of the economy's pulse we have to go straight to the stock market itself, and also to the liquidity measures provided by the Fed. If the news media did this instead of focusing on "yesterday's news" there would be less panic and reactionism on the part of investors each and every time the economic numbers come in less than expected.
Truth be told, the housing market recession is probably the best thing that could have happened to the U.S. economy right now. I say this because it has done more than any single factor to awaken the Fed from its torpid stance on money supply and hawkishness on interest rates. In reality, the bankers helped strangle the strong upward momentum in housing prices (just as it created the housing bubble to begin with) with its restrictive money lending measures. The Fed Chairman has publicly stated several times this year that the housing market is one of the Fed's primary concerns with respect to its tight money policy.
The Fed has once again gone too far in tightening and the economy has come to the brink of recession because of it. As market strategist Don Hayes recently wrote, "Let's fire the Fed and use our yield curve to determine Fed policy. It would have prevented so much of this wild micro-management Fed decisions that history was shown to be so wrong. It now says the Fed Funds rate should be somewhere in the range of 3 1/4 to 3 7/8 %. It also would have never gone to 1% which the Fed is now admitting was based on a wrong assumption of wrong data. So what's new?"
Yet the bond market is telling the Fed that the interest rate is too high and will have to be lowered in order not to resuscitate economic growth and to prevent further economic contraction. Another leading indicator is Eurozone inflation, which has fallen to its lowest level in seven years, according to the Financial Times of Nov. 1. The recent sharp declines in the oil price is a further indication that inflation is no longer the chief concern to the forward-looking financial markets as it was earlier this year. It's time for the Fed to recognize this and respond accordingly.
Hays predicts, "The world will [eventually] rely on the bond market as their discipline....we wouldn't have had the same degree of tech bubble in 2000, or the housing bubble in 2005 as is being recognized now. And we wouldn't be in today's precarious condition either as they would have stopped raising rates last year when it was around 4%."
Now that the Fed has once again gotten what it wanted, viz., a housing market slowdown, it has finally started opening the monetary spigot. As Donald Rowe of the Wall Street Digest recently pointed out, "Fed Chief Bernanke is pumping-up the money supply to stop the fall in housing. The M2 money supply and the MZM money supply are both growing." The 13-week growth of M2 and MZM money supply has now soared up to 6.2% for MZM and 5.9% for M2, according to the latest St. Louis Fed release this week. The Fed created another $18 billion in M2 money last week and $88 billion in the past month. Bank credit is also on the rise. And in the coming weeks the money supply statistics should show even more liberal money supply increases as the Fed once again over-reacts in the opposite direction as it tries to quickly undo the damage it created beginning in 2004 when the tightening measures started. The Fed will also be forced to start lowering interest rates in the coming months as the bond market has already led the way for them.
But the biggest tell-tale sign that the housing market is on its way to a soft-landing and recovery is the message being shouted loud and clear from a leading stock market index. Of course the index I'm referring to is the Dow Jones REIT Index (DJR) which has been one of the most bullish of the sector indices in recent months. DJR has been making new all-time highs on almost a weekly basis. When real estate is down yet one of the primary leading indicators for real estate, namely the REITs, are zooming forward to record levels what does that tell you? It's a wonderful testimony to the market's discounting mechanism and it tells me that the anticipated impact of this year's real estate slowdown is being drastically overstated by the media. It tells me that things are nearly as bad as they appear beneath the surface for the composite U.S. real estate market. It further tells me that, as Donald Rowe suggested in the above paragraph, the Fed will pull out all the stops to re-liquify the financial system in its attempt to resuscitate the housing market and, by extension, revitalize the overall U.S. economy.
Earlier in this commentary mention was made of bank credit. What is the significance of this indicator? Intermediate-term, bank credit is the single most important economic statistic and is a primary measure of the very lifeblood of commerce. Indeed, the bank credit trend is even more important than any other measure of currency or money supply. With that in mind let's take a look at some interesting trends in bank credit growth (or contraction) over the last several years and up to the present day.
Many of you no doubt remember the stock market and economy of the 1980s. Basically the '80s can be divided into two sections: the rather slow growth of the first half of the decade, punctuated by a mild recession sometime around 1981-1982 (depending on who you talk to) and further characterized by the birth of the major long-term bull market in stocks in 1982. This was followed by a steady loosening of bank credit following the end of the '82 recession all the way up until early 1986. This was one of the major contributing factors of the boom times of the mid-1980s.
The second half of that decade was marked by a steady contraction in the bank credit growth trend. It culminated with a sharp drop at the end of 1987 and was one of the factors contributing to the crash of '87. The bank credit trend from the early 1980s until the middle of the decade shows a rather sharp contrast to the trend from the mid-'80s until the end of the decade.
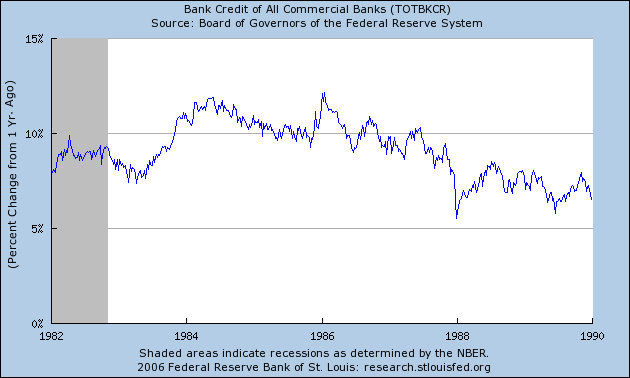
The declining trend in bank credit growth from 1986 onward continued into late 1991 when it finally bottomed. This coincided with the somewhat pronounced economic recession of that same year. The banks seemed to have waited until after the election of Bill Clinton to begin loosening bank credit, which occurred once again in 1993 and continued unabated until about 1996. This was a major factor in the strong bull market in stocks and the white hot economic growth of the mid-to-late 1990s.
From 1996 onward the bank credit growth rate becomes extremely volatile, see-sawing back and forth between 10-11% growth rate to a 3-5% growth rate between the years 1996-2001. This volatility produced many speculative bubbles along with extreme bull markets and bear markets in a number of financial asset categories. It made many fortunes but also produced many bankruptcies and brought with it a corresponding socio-political agitation, the implications of which have never been fully grasped.
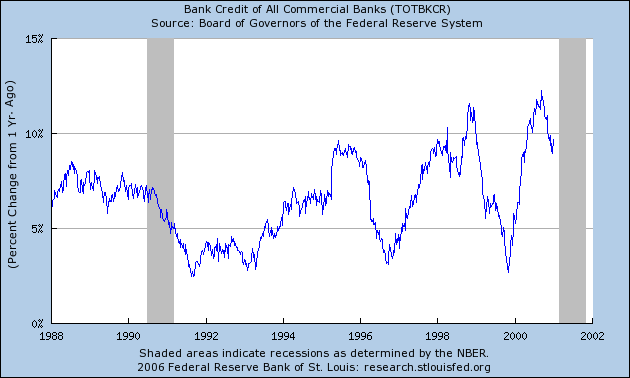
After another huge run-up in the bank credit growth rate from approximately 3% in late 1999 to around 12% in late 2000, bank credit growth took another big plunge into 2001 and with it came the economic recession and stock market bear of 2001-2002. This was followed by yet another huge increase in the bank credit growth trend from 2002-2003 and this helped the economy to recover as well as put the financial markets back on a sounder footing.
Another sharp pullback into 2004 corresponded with the 10-year cycle bottom and the year 2004 saw a definite slowdown in the stock market and economy up until the fourth quarter of that year. Since that time bank credit growth was allowed to gradually rise into early 2006, yet the growth rate of credit has never exceeded that of 2003 but has stayed below the peak from that year. Just last week the Commerce Department released GDP statistics which showed U.S. economic growth slowed in the third quarter of 2006 to its lowest level in more than three years. Is it any wonder in light of the bank credit trend from 2003 until now?
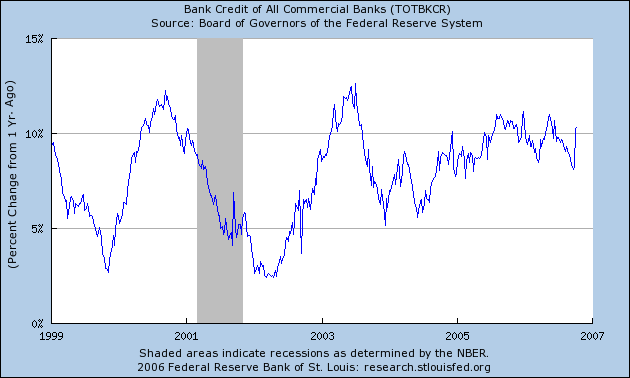
In more recent times, bank credit actually made an interim peak, on a percentage change basis, back in mid-2005. Since that time bank credit growth has actually trended lower before bottoming in September '06 along with the 8-year liquidity cycle. Following this cycle bottom was a conspicuous spike in bank credit which we talked about last week and can be seen in the latest bank credit chart, courtesy the St. Louis Fed. It's good to finally see this increase in liquidity but this isn't enough by itself - a further credit increase is needed to ensure a steady bull market and economic recovery in 2007. Based on the recent 8-year cycle bottom, however, we can expect bank credit to continue its expansion heading into 2007.
November 4, 2006
Subscribe to Momentum Strategies Report to find out the short-term and intermediate-term direction for the U.S. stock market and the various stock sectors, including gold/silver, oil/gas, semiconductors, REITs, biotechs, and transportation. Our proprietary internal momentum indicators and moving averages keep us on the right side of the markets and have allowed us to capture the important moves in equities for the past several years. Find out the technical outlook on numerous individual stocks from a short-term and intermediate-term standpoint. Subscribe for a year and get a FREE bonus: A copy of the book "Stock Trading with Moving Averages" by Clif Droke.
Naked man arrested for concealed weapon
posted by UncommonBusiness @ 9:23 AM
![]()
